;)

;)


;)
;)
;)
;)
;)
;)

;)
;)
;)
;)
;)
;)
;)
;)
;)
;)
;)
;)
;)
;)
;)
;)
;)

;)
;)
;)
;)
;)
;)
;)
;)
The Course Overview widget is a handy dashboard to see some analytic data about your course and your students.
To find the widget, scroll to the bottom of the course home page:

At the top of the widget, there is a graph showing the number of visits (by any user) in the past week.
Just below the graph, there will be text indicating the number of visits to the course today (if any) and the number of quiz submissions (if any).
Below this text (and the horizontal line) are three links to even more information:
Class Engagement
Clicking on the "Class Engagement" link will navigate to a new page showing the Class Engagement report:
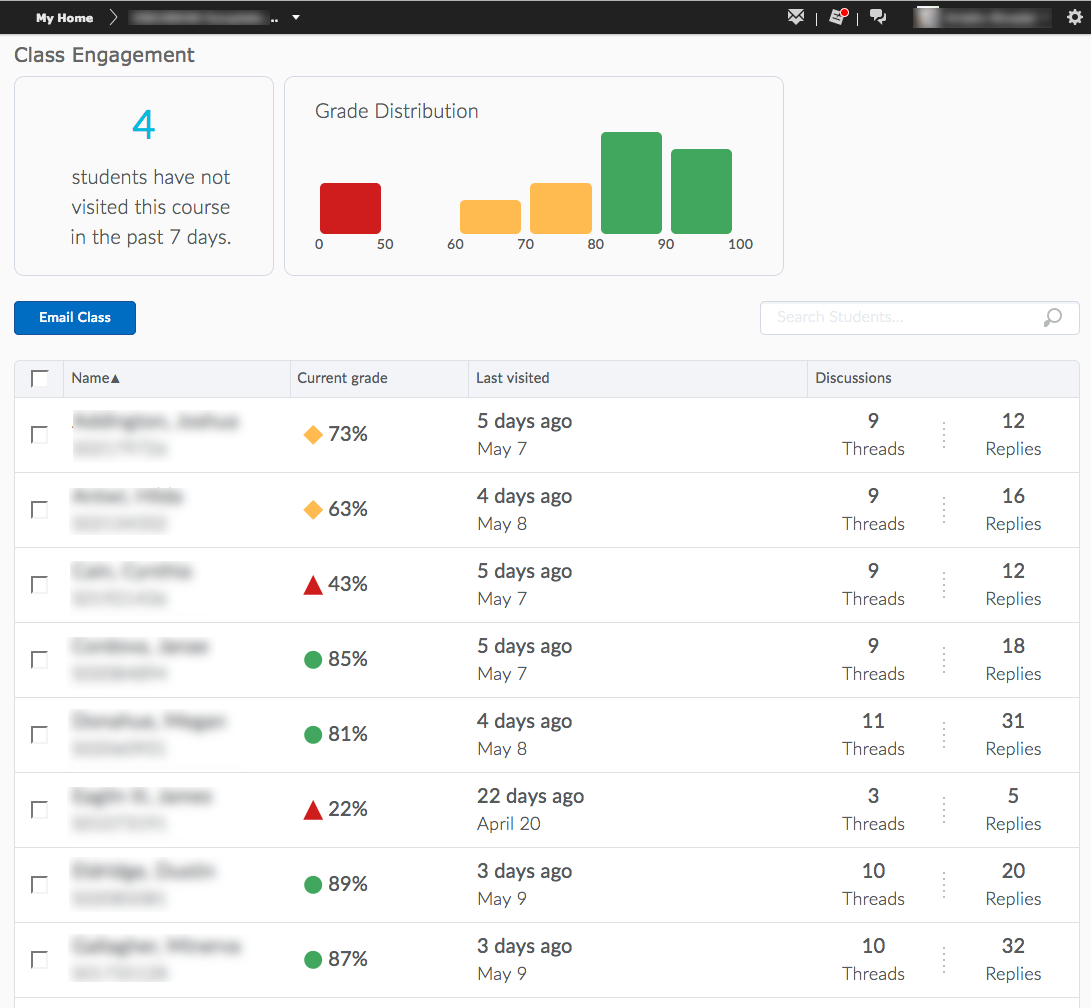
At the top left will be a text box with information about the number of students that have not visited the course in the past 7 days. (Note that any Jenny Student will be included in this information.) Clicking on this text will filter the student names down to those that have not visited. This will allow you to see who those students are and, by clicking the check box at the top of the table (to the left of the "Name" label), you may send an internal message those selected students.
To the right of the textual visit information is a bar chart of the students' current grade distribution. (If your gradebook treats ungraded items as zeroes, the distribution may be skewed to lower grades.) Clicking on any given bar, you can filter to that group of students and, as instructed above, send an internal message to those students.
The table of student names also shows the total number of discussion postings that each student has made in the course. This will include all discussion boards whether or not they are graded.
To return to the course homepage, either use the back button on your browser or click the course name in the black minibar
Course Access
Clicking on the "Course Access" link will navigate to the Course Access report:
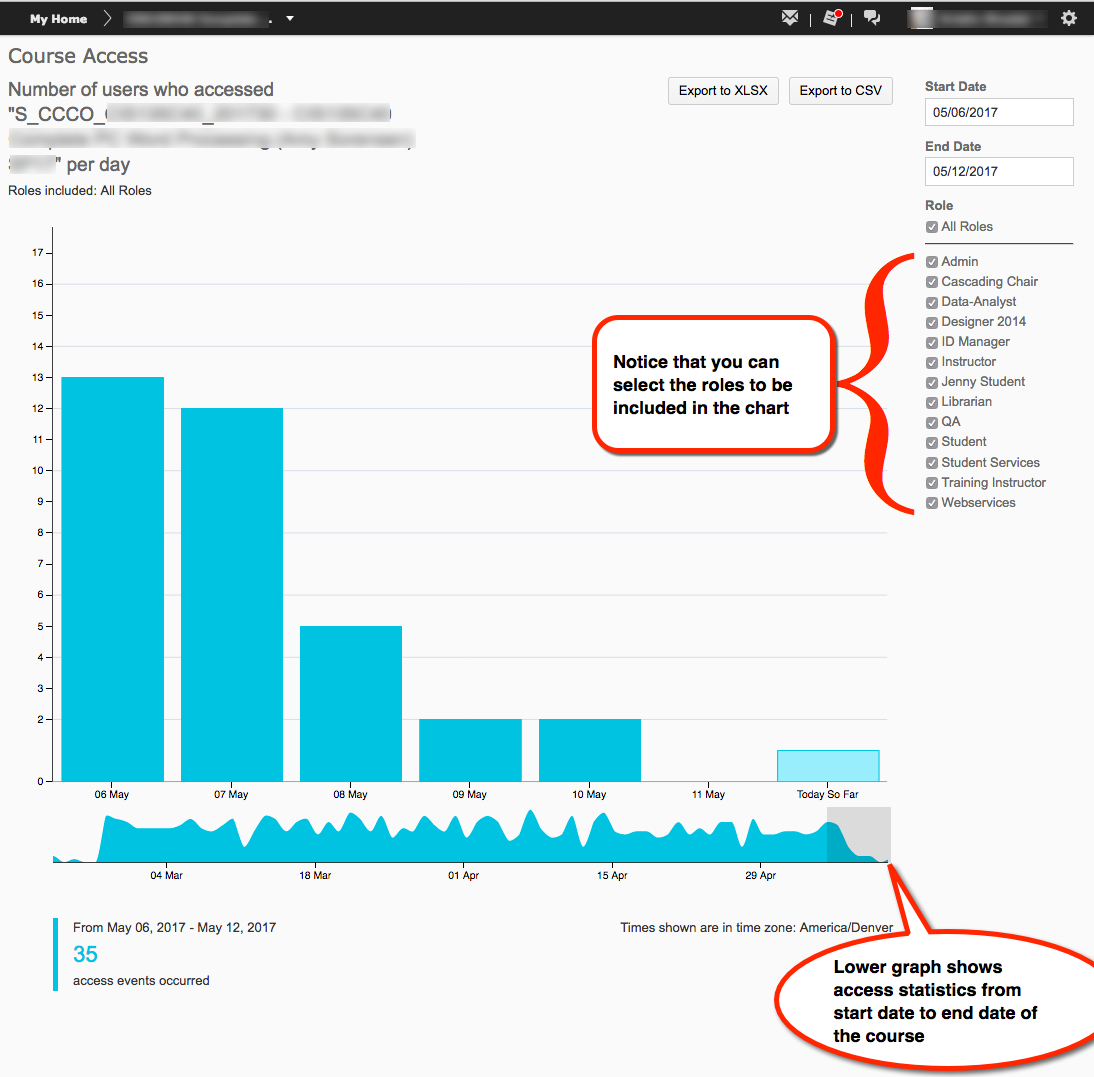
At the top of the report are buttons to export the report in either a Microsoft Excel format or a .CSV (Comma Separated Values) format.
By default, the report displays the data for the past 7 days for all user roles in the system. Use the filter options on the right side of the screen to filter for different start and end dates or to see various user roles (descriptions of these roles can be found at the end of this article).
The graph below the bar chart shows access events from the start date of the course through the end date.
The text below the charts/graphs will list the number of 'access events' for the time frame shown in the bar chart. An access event is a user accessing the course's home page.
To return to the course homepage, either use the back button on your browser or click the course name in the black minibar
Tool Access
Clicking on the "Tool Access" link will navigate to the Tool Access report:
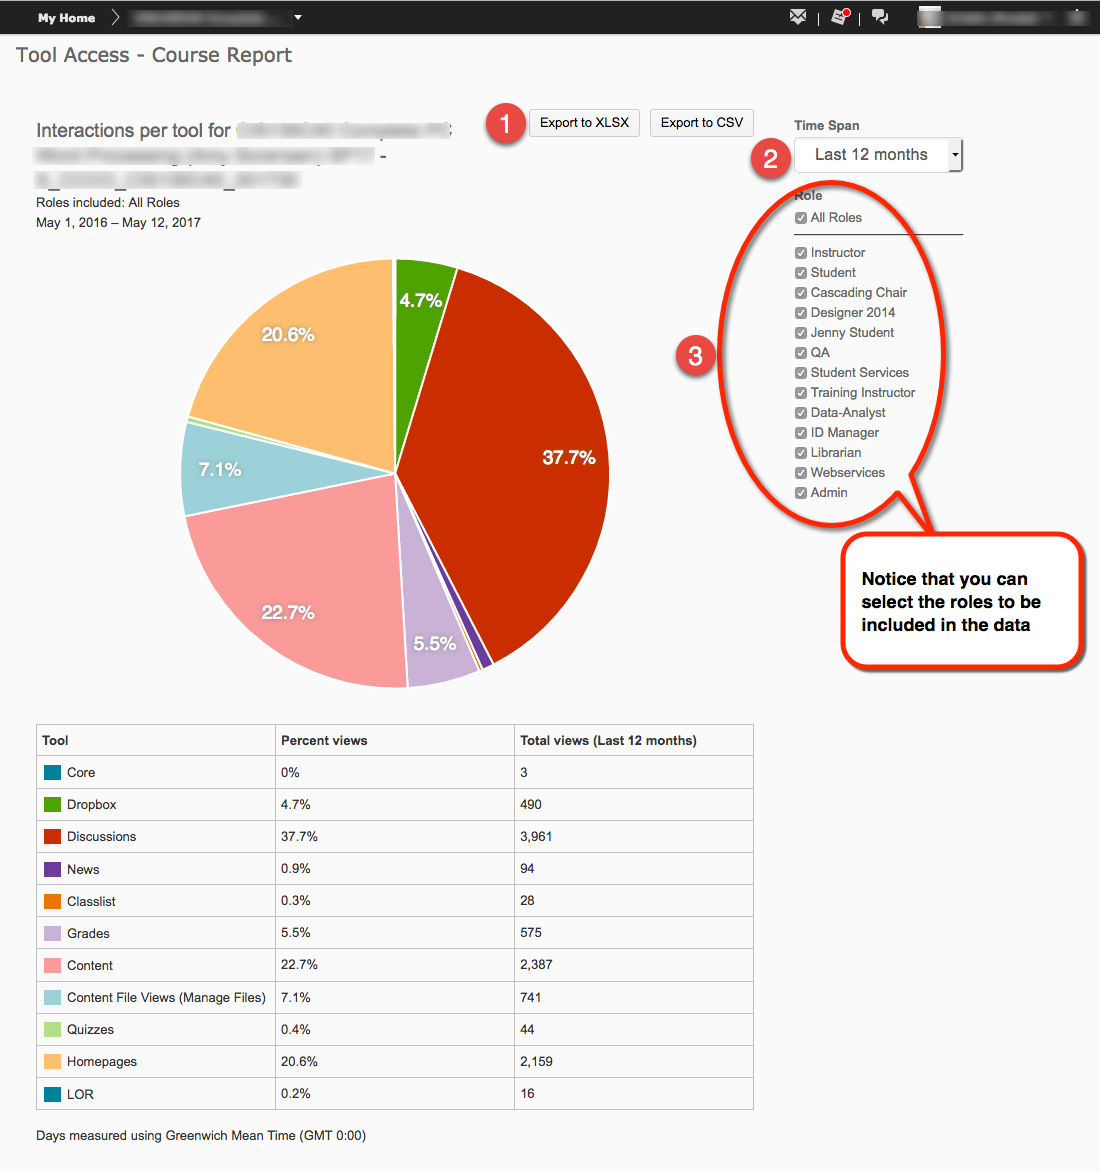
The pie chart shown on the Tool Access report shows the percentage of overall use for that tool in the timeframe selected. The table below the pie chart shows both the percentages and the actual count of views for that tool.
- Use the buttons at the top of the page to export the report data to either a Microsoft Excel format or to a .csv (comma separated values) format
- Use the drop down menu to select the time frame that you want to view
- Uncheck any roles you will to exclude from the report (or check them to include that data)
To return to the course homepage, either use the back button on your browser or click the course name in the black minibar
Role descriptions:
- Instructor: Any user enrolled in the Instructor or QM instructor role for this course.
- Student: Any user enrolled as a Student or Incomplete in the course.
- Cascading Chair: This is the role used by Program Chairs, Associate Deans and other academic supervisory roles.
- Designer: this role is used by the instructional design team. They may access courses as they work to resolve course maintenance issues.
- Jenny Student: the "demo" student role
- QA: The role used by the Center for Excellence as they perform evaluations.
- Student Services: used by the Student Services team and student technical support staff.
- Training Instructor: Used only in the Training Department by those evaluation professional development courses
- Data-Analyst: used only by the CCCO data analyst for the collection of data as requested by CCCO leadership.
- ID Manager: used by the instructional design team manager
- Librarian: Used by the CCCO librarian in order to gather information needed to assist students
- Webservices: a programmatic role used to automate certain tasks or system monitoring functions.
- Admin: Used only by AT-Support staff

